
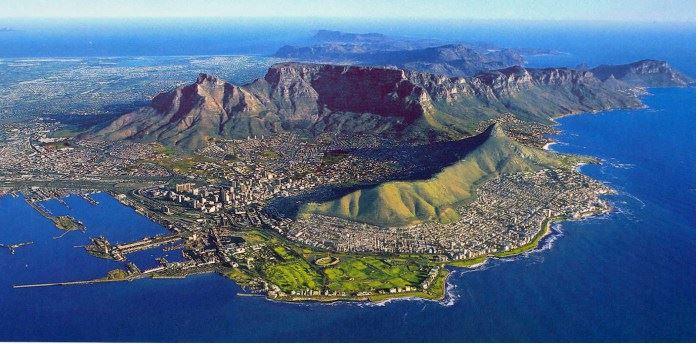
Cape Town Property Market's Latest Quarterly Capital Growth Percentages
According to Lightstone property indices for April 2018, Cape Town is continuing its unmatched growth in market activity, coming in at 9.3%. Upon closer inspection, however, it becomes clear that not all Cape Town property is created equal.
The FNB Property Barometer for Cape Town, published in May, points out that Cape Town’s year-on-year price growth, while still the strongest in the country, has seen its 7th consecutive quarter of slowing. The Atlantic Seaboard, Cape Town’s most expensive suburb, saw a jarring slowdown, down from 27.5% in Q4 2016, to 2.3% in Q1 2018. John Loos, FNB Household and Property Sector Strategist, comments: “This does not surprise us, as this sub-region has experienced the most rapid cumulative growth of all the sub-regions over the past 5 years, to the tune of 111%.”
While the upper-end of the market is seeing a marked slowdown, more affordable suburbs are booming. “Arguably reflective of the heightened search for relative affordability in or near to Cape Town’s prime place of employment, the City Bowl, is the indication that the most affordable sub-region within close proximity to the City Bowl, i.e. the Near Eastern Suburbs sub-region (including amongst others Salt River, Woodstock and Pinelands), shows the fastest house price growth of these “Major 4” sub-regions in or near to the Cape Peninsula,” says Loos.
Moving even further afield, all three major Northern Suburbs have seen double digit growth. The Western Seaboard region, including Blouberg, Milnerton and Melkbosstrand, saw a slowing in year-on-year growth, from 14.7% in the previous quarter to 14.4% in Q1 2018. The Durbanville-Kraaifontein-Brackenfell subregion continued its mild acceleration, from 9.8% in the last quarter to 10.1% in Q1 2018.
In the city’s affordable regions, the report notes that the Cape Flats house price index experience a further growth acceleration (from 11.4% in the last quarter to 11.6%). The Elsies River-Blue Downs-Macassar region also saw acceleration, reaching 25% up from 23.7% in the last quarter. Loos attributes these growth patterns to a need for more affordable housing: “We believe this continues to be the result of the relative in-affordability in higher end sub-regions after recent years of strong price growth, encouraging a search for relative affordability lower down the price ladder in the more affordable sub-regions.”
Those looking to invest in the inner city would do well to heed the signs of the times. Explains Carola Koblitz, editor of the CCID State of Cape Town Central Report: “Just as it is evident that residential property in the CBD has stabilised, it is also evident to astute investors where future opportunities lie: in well-priced units affordable to the large number of professionals, across the broad economic base, who work in and desire to live in the Central City.”