
South African Property Market Report for 2019
It has not been an easy year for most South Africans and we were blessed with "interesting times" which resulted in a great deal of change, speculation and uncertainty. Our economic climate extends to, and influences, the property market but it's definitely not all just negative news. There are some segments that have managed to successfully navigate the tough market conditions - especially in the property market priced below R1,5 million which forms about 80% of all property sales.
According to Lightstone there are 6 665 868 properties worth R5,5 trillion in South Africa of which 261 097 properties have been sold between January and November 2019 - worth R210 billion. During 2018 315 899 properties transacted at an amount of R243 billion.
The number of sales per month has therefor decreased by 9,8% from 26 324 properties in 2018 to 23 736 properties per month during 2019 - excluding December 2019 sales. The average monthly property sales value has also decreased by 5,73% from R20,25 billion to R19,09 billion per month.
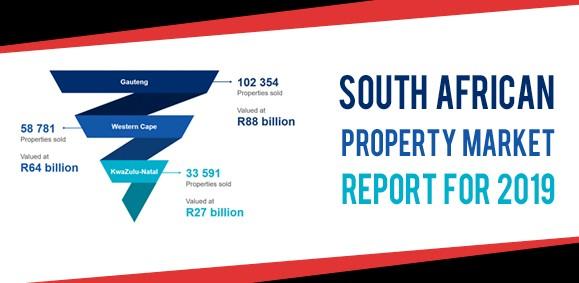
The three biggest property markets in South Africa is Gauteng, Western Cape and Kwazulu-Natal dominates the property sales playing field at present with 194 726 sales for the first 11 months of 2019 - effectively representing 74,6% of all property sales in South Africa.
- Gauteng was the top province in terms of property transactions with 102 354 sales, valued at R88 billion,
- followed by Western Cape with nearly half the amount of properties sold, 58 781. worth R64 billion.
- there were 33 591 property transactions worth R27 billion in Kwazulu-Natal.
The annual national house price inflation for South Africa is currently at 2.9%. Western Cape have seen a recent slowdown, after a long streak of unrivalled outlying performance, giving the top inflationary growth spot to the province of Limpopo, with an annual inflation figure of 5.9%.
The Western Cape has been, and still is, the best destination for semi-grants but the sentiments are slowly changing as indicated by the slowdown of its property market. This market is hugely dominated by the City of Cape Town municipality, which over and above the price correction, has taken a knock from rising crime stats, the recent water crisis, local government uncertainties and looming competition along the east coast.
Limpopo province on the other hand has seen an increased demand for high-end properties most of which have become second homes to wealthy Gauteng residents. There is also a considerable amount of mining activity in the province driving up the demand to house workers, and several new developments are meeting this demand.
Our inland municipalities Ekurhuleni, City of Tshwane and City of Johannesburg metros are growing at stable rates between 1% and 4%, whereas the coastal municipalities are generally performing above this range. This relationship extends to all coastal and inland properties. The Low and Mid value wealth segments continue to buck the trend by growing at more than 4% annually with the rest inflating at rates below that.