Myburgh Park - Langebaan - Property Market Report 2019
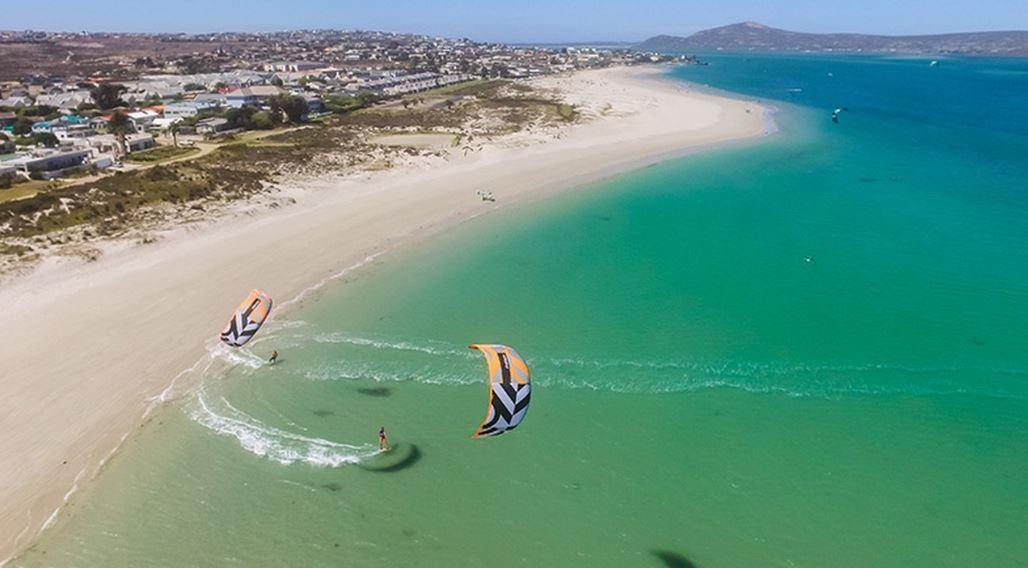
Myburgh Park suburb in Langebaan is a well-established and upmarket residential suburb with beautiful hillside views. It is located on the south side of Langebaan, near the entrance to the West Coast National Park. The larger part of the lagoon is visible from Myburgh Park with properties with lagoon views being more sought after and in high demand by buyers looking for a holiday or retirement home.
- Myburgh Park Owner Profile / Demographics.
The average household income range in Myburgh Park according to Lightstone is R30 000 to R40 000 which average places the owners in the LSM 8 high group.
The period or tenure of ownership, which is a measure of ownership stability, shows that the existing owners who have owned their property for 11 or more years are 53% with another 10% having owned property for between 8 and 10 years. The high combined figure of 63% of property owners having owned property for more than 8 years points to stability and owner satisfaction and is also indicative that Myburgh Park is one of the older, more established suburbs in Langebaan. The relatively high figure of 38% having owned their properties for less than 5 years is an indication that Langebaan is a growing town with new houses being built which attract a wide range of prospective Buyers.
The age profile of the stable owners in Myburgh park shows that the majority of owners, 48%, fall in the mature age group, (50 - 64 years old), followed at 22% by the middle aged group (36 - 49 years old).
- Youth/Adult: (18-35 years) - 3%
- Middle Aged: (36-49 years) - 22%
- Mature: (50-64 years) - 48%
- Pensioner: (65 and older) - 28%
The recent buyers' age profile is interesting in that it shows very similar interest from the Middle Aged and Mature groups with a sharp increase in the number of buyers from the Youth/Adult group when compared to current owners. The low number of buyers in the Pensioner Group in Myburgh Park mirrors the overall trend of a younger Langebaan population with the breakdown of recent buyers being as follows:
- Youth/Adult: (18-35 years) - 26%
- Middle Aged: (36-49 years) - 33%
- Mature: (50-64 years) - 33%
- Pensioner: (65 and older) - 9%
- Myburgh Park Real Estate Market In Property Types
Myburgh Park consists of 1 083 own title or freehold houses and 40 sectional title properties. Just 16 of the freehold properties are situated in estates.
- Property Sales In Myburgh Park
During the 12 months from April 2018 until March 2019 a total of 44 freehold houses were sold at an average selling price of R2 535 000. These 44 houses were in the following price brackets, 1 was sold for R710 000, 6 were sold between R800 000 and R1 500 000, 28 were sold between R1 500 000 and R3 000 000 and 9 were sold for more than R3 000 000.
During the 12 months from April 2018 until March 2019 a total of 2 sectional title properties were sold at an average selling price of R500 000.
During the last 12 months from April 2018 until March 2019 a total of 40 vacant plots were sold. There was 1 freehold plot sold in an estate for R350 000 and 39 freehold plots out of estates were sold at an average selling price of R667 000. These 39 freehold plots were in the following price brackets, 33 were sold between R400 000 and R800 000 at an average price of R571 000 and 6 were sold between R800 000 and R1 500 000 at an average price of R1 198 000.
Average & Top House Prices achieved in the 6 months October 2018 to March 2019:
- Average house price:. 13 Houses sold for an average price of R3 113 077.The highest price being realised was R9 900 000 with the lowest price being R1 480 000. The 3 top prices achieved were 22 Cormorant Close for R9 900 000, 8 Cormorant Close for R5 650 000 and 17 Sunbird Drive was sold for R2 800 000.
Average & Top Vacant Land Prices achieved in the 6 months October 2018 to March 2019
- Average vacant land price: 14 vacant plots sold for an average price of R822 785. The highest price being realised was R1 500 000 with the lowest price being R420 000. The 3 top prices achieved were 26 Heuningbos Close for R1 500 000, 22 Lemoenbos Close for R1 485 000, and 15 Sunbird Drive for R1 285 000.
- Capital Growth in Myburgh Park
Median prices and capital growth for homes achieved:
- Myburgh Park's median prices for homes has during the last 10 years grown from R1 350 000 in 2009 to R2 250 000 in 2018 - i.e. a growth of about 66.7% or about 6.7% a year
Median prices and capital growth for vacant land achieved:
- Myburgh Park's median prices for vacant land has during the last 10 years grown from R410 000 in 2009 to R590 000 in 2018 - i.e. a growth of about 43.9% or about 4.4% a year
For more information about the available properties within Myburgh Park in Langebaan, please follow the link to our website.