
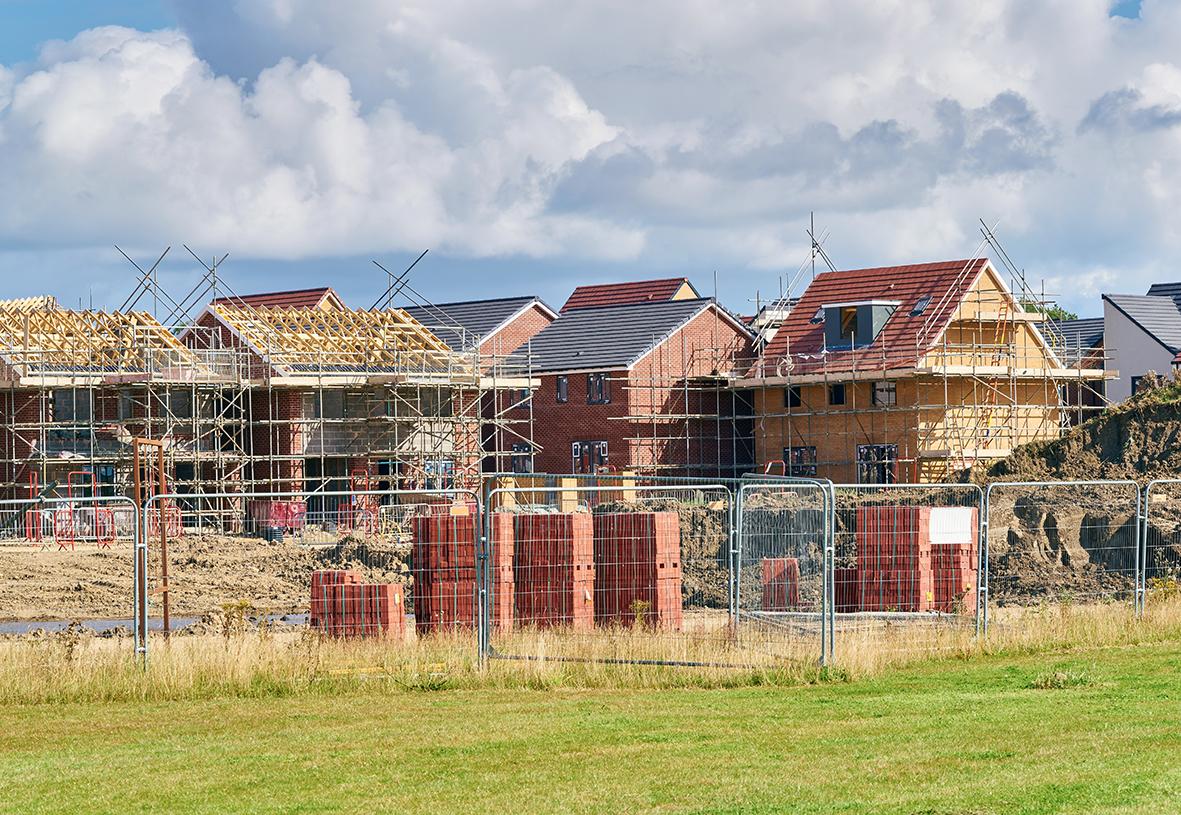
SA Residential Building Statistics For 2019 - Planning & Construction Phases
New housing units reported as being completed were up by 36% year-on-year (y/y), or 8 581 units, to a total of 32 435 units in the 8-month period January to August 2019.
The flat and townhouse segment remained the main driver of the growth in new housing built, showing continued strong growth of 91,5% y/y, or 9 227 units, up to August 2019. Of all residential building activity, flats and townhouses formed 59,4% of all residential building activity in the period January to August 2019 - whilst houses larger than 80sq.m. formed 20,6% and houses smaller than 80 sq.m. formed 20,6% of all residential activity.
Building plans approved for new housing contracted in all three segments of housing in the first eight months of 2019, with plans declining by 15,5% y/y, or 6 583 plans, to 35 977 plans in January to August.
The average building cost of new housing completed was as follows in the three segments in January to August this year:
- Houses of <80m2: R5 752, down by 0,6% y/y.
- Houses of ≥80m2: R7 557, up by 2,7% y/y.
- Flats and townhouses: R8 269, up by 4,4% y/y.
Building activity with regard to alterations and additions to existing houses continued to show a fair amount of strain, with both the building area approved and the building area reported as completed contracting on a year-on-year basis in January to August.
The building cost of completed alterations and additions to existing houses increased by 2,5% y/y to a level of R7 400 per square meter in the 8-month period up to August compared with R7 218 per square meter in the corresponding period last year.
An alarming discrepancy in residential building activity has developed between the different provinces in South Africa in terms of buildings completed in the period Jan-Aug 2019 - with 83,1% of all residential building activities taking place in Gauteng (58,1% / 18 842 units completed) and the Western Cape (25% / 8 111 units). The provinces which experienced "a near stand-still" in residential buildings completed were Northern Cape (0,4% / 128 units), Free State (0,5% / 155 units & Limpopo (1,3% / 422 units).
An economically strong province such as Kwazulu-Natal only had 6,3% or 2 032 new residential buildings completed - which is only 25% of the units completed in the Western Cape or 10,8% of the units completed in Gauteng.
According to Stats SA, the private sector financed 1 356 700 residential buildings between 1994 and 2019 (year-to-August) - of which 44,8% (607 137) were houses smaller than 80sq.m, 26,8% (363 983 were houses larger than 80sq.m. and 28,4% (385 580) were flats and townhouses.
Residential building activity will continue to be driven by trends in and prospects for the economy, household finances, business conditions in the building sector, levels of consumer and building confidence and property market sentiment.